P: Geodata presentation, geovisualization and dissemination
While editing on the screen, the interactive graphic presentation form under modern graphic user interfaces the GUI plays the decisive role in communication between the user and the system. The most important basic functions such as display management, display, pan, zoom and window technology are provided here.
The results of spatial queries and analyses can then be presented in a wide variety of forms. In addition to maps, there are many other representations such as perspectives, longitudinal sections, visibility maps, cartographical diagrams, overlays of raster data and vector data, etc. (cf. Hake et al., 2013).
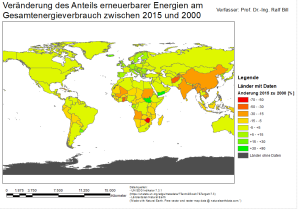
Thematic map on Sustainable Development Goals, an exercise in the GIS exercise section.
In addition to map output, data presentation also includes various other output forms such as tables, diagrams, reports and multimedia components. For alphanumeric output, reports and lists can be generated that present database excerpts and thematic overviews. Ad hoc queries in SQL to examine the database according to certain criteria are just as important as permanently recurring queries, which are stored as macros and simplify daily work with the system. A comprehensive overview can be found in Bill, 2016, Chapter 8.
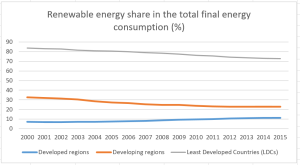
Diagram representation of the temporal behaviour of an SDG indicator
The possibility of enriching maps with images, video, audio, Virtual Reality or by a combination of the virtual world with the real world by means of Augmented Reality, facilitates a much better communication of plans with the citizens affected.
Geodata must also be made available to mobile users. For example, tablet or laptop computers equipped with GNSS can be used by the employees of an administration to maintain and update the extensive databases. The citizens of a city, the visitors or the potential investors already use geodata today and expect even more geodata on their smartphones in the future.
Today, data and results from GIS are regularly required by third parties in digital form for integrated further use for their own purposes and are to be made available in readable exchange formats to different software systems such as CAD, DTP, databases and word processing, possibly via the Internet/Intranet. The analog formats/cards are usually only used for legal proof. In the GIS environment, data can be exchanged either in raster or vector format. Raster data is a simple image of the visualization of the GIS content in black/white or color information for the individual pixels. Further attributive or relational information is missing. Common image processing formats include Tagged Image File Format (TIFF), JPEG Interchange Format (JPG) and Portable Network Graphics Format (PNG). These are suitable for exchanging 2D raster image data, such as aerial and satellite images or classified value fields in which the values are coded in a finite number of colors or grayscales. The geocoding (origin, cell width, orientation in the underlying coordinate system) of the image data can either be carried directly in specially extended formats (GeoTIFF) or stored in additional files (world files). Furthermore, some, mostly generic standard formats have been established for the exchange of 4D raster data with different topics, space and time reference systems. Examples are the Hierarchical Data Format (HDF), the Grid in Binary Format (GRIB) and the Network Common Data Format (netCDF), a binary file format that is machine-independent by specifying the byte order in the header. NetCDF has established itself as an open standard. These formats are also frequently used for the exchange of measurement and simulation data.
In addition to raster formats, vector formats in particular are used for data exchange in the GIS environment. Initially, specific vector exchange formats between individual components were defined, partly for the sake of apparent simplicity and/or quality (e.g. the exchange formats EDBS (Uniform Database Interface) for ALK data and NAS (norm-based exchange format) in the AAA context) or to distinguish oneself from competitors as a manufacturer. Examples are formats such as dxf of the company Autodesk and the shape (SHP) of the company ESRI, which is widely used in GIS. Today, more and more standardized data exchange formats based on the Extensible Markup Language (XML) are used, especially for spatial data of the Geography Markup Language (GML) (see ISO 19136 Geoinformation - Geography Markup Language (GML)). These formats, which generally define spatial structures (points, lines, polygons in 2D or 3D), are extended for specific technical purposes, e.g. for water (WaterML), building (CityGML) or national cadastral areas (GeoInfoDok). In the international field, the OGC has been formed - in addition to the ISO standardization body with the 191xx family of standards - in which administrations, research institutions and companies collaborate to develop processes and spatial standards of the highest quality. In the example of the current cadastral system in Germany in the form of ALKIS, the standards-based exchange interface (Normbasierte Austauschschnittstelle NAS) including a user-related inventory data update (Nutzerbezogene Bestandsdatenaktualisierung NBA) was established as an exchange format. With NBA secondary data sets can be updated by differential data delivery. The provision of historical states is also possible here.
