A: Spatial data analysis
From the point of view of the database systems on which the geo-information systems are based, analysis functions can generally be divided into standard and non-standard analyses. Standard analysis methods are those methods that can be implemented using queries available in relational database systems and derived from relational algebra. These operations include, for example, the selection of values that fulfill certain conditions (SELECT * FROM TABLE WHERE ..), logical links using Boolean algebra (AND, OR, NOT), sorting or grouping of data series (SORT, GROUP BY), or the derivation of simple statistical (AVERAGE, MAXIMUM ..) parameters that can usually already be formulated on relational databases using the query language SQL (Structured Query Language). Queries and analyses, on the other hand, that require special geometric, topological or temporal operations are non-standard analyses and require corresponding systems such as GIS. As previously described, selected geometric-topological functions may be already contained in object-relational databases, provided that these are extended by spatial data types and operators, e.g. in Microsoft SQL Server, Oracle Spatial, MySQL or PostgreSQL (PostGIS). PostGIS as a spatial extension for PostgreSQL offers spatial data types such as polygons, polylines and points, spatial operators for comparing geometries regarding overlapping and spatial functions such as area and distance calculations, area intersections, buffer formation or coordinate transformations.
Data analysis is the heart of a GIS. This includes functions such as polygon overlay, network analysis, digital terrain analysis, report generation, statistical analysis and many special functions derived from the application requirements, which are increasingly provided. For example, the information can be provided to guide vehicle drivers from a starting point to a destination using the shortest route calculation via the car navigation systems on board.
Grouping and selection of common GIS analysis methods
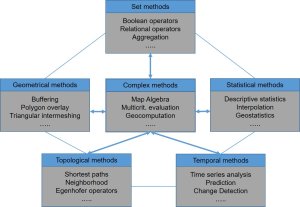
Analysis methods can be roughly divided into 6 groups (for functionalities and methods see Bill, 2016, chapter 7 resp. de Smith et. al. 2018):
- Geometric methods are essentially based on the mathematical foundations of geometry. They are characterized by calculating with coordinates. Important functions are the distance and area calculation (e.g. for parcels of a municipality), the zone or buffer generation (e.g. around a planned route), the point in polygon check - explained in the video (e.g. measuring points in a district), the polygon overlay (e.g. parcels versus real land use, see video) and the triangular intermeshing (e.g. digital terrain models).
Point-in-PolygonPolygon Overlay - Topological methods are based on neighbourhood relations; they essentially use graph theory as a mathematical basis. They can be used to express neighborhood relations (two parcels bordering each other) without using coordinates. A well-known function is the calculation of the shortest paths in a network (e.g. a pipeline network).

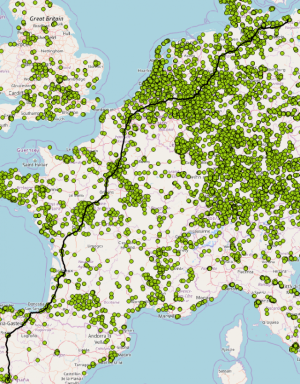
Shortest path from Rostock to Madrid (an exercise in electromobility).
- Set methods are based on Boolean and relational algebra. They are used to limit selective queries on the dataset (for example, all parcels larger than 1,000 square meters and suitable for development). Typical functions are also the sorting of data (e.g. by size or alphabet) for tabular output reports. A more complex method is aggregation, illustrated in the video.
Aggregation - Statistical methods are based on probability theory and stochastics. The functions offered range from simple descriptive statistics (e.g. mean size of parcels in the municipality, the video shows a boxplot generation) to inductive statistics and geostatistics (e.g. interpolation of groundwater levels in a municipality using Kriging).
Boxplot creation - Temporal methods allow spatio-temporal evaluations. This ranges from simple time operations in selective queries (before-after) to interpolations or extrapolations as well as time series analyses.

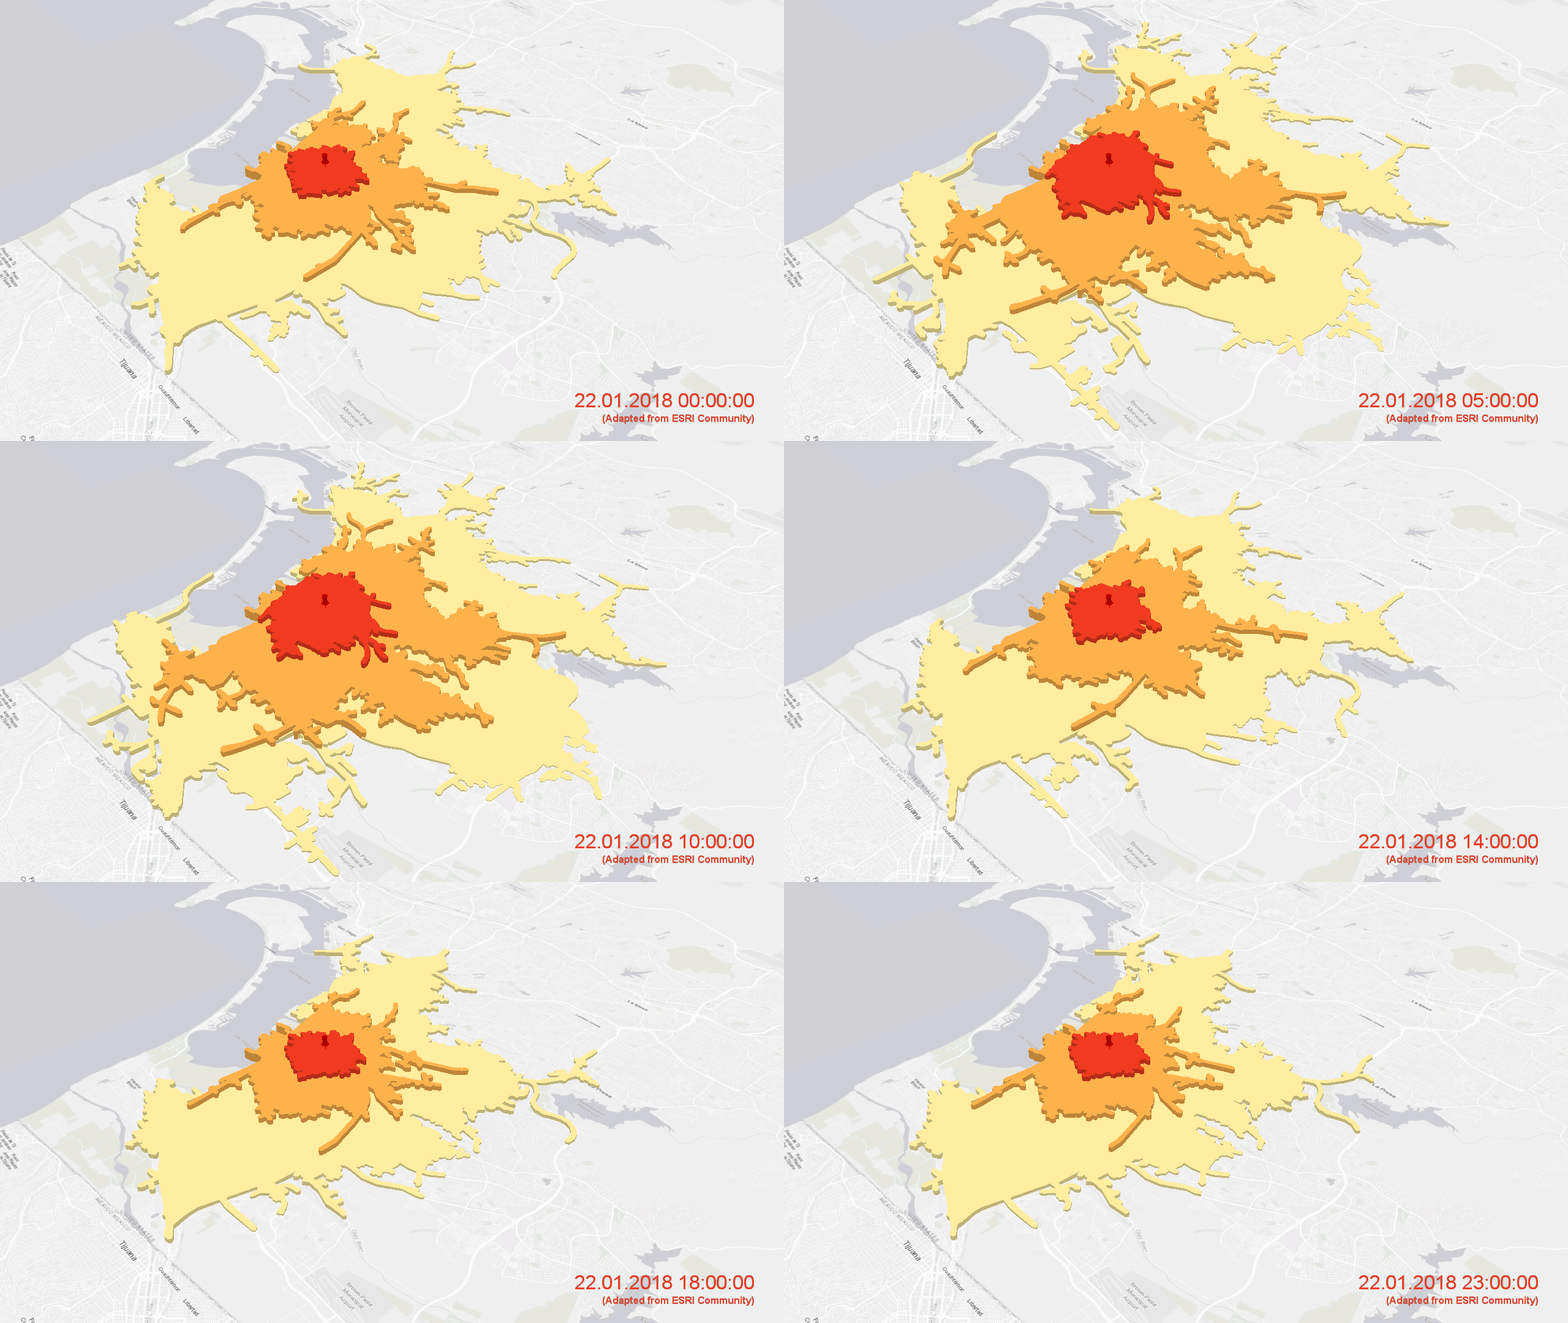
Road accessibility in the San Diego road network from a central point in four, eight and twelve minutes for different times of the day (animated with ArcGIS Pro using an ESRI road data set)
- Models and simulations as complex methods are specially compiled processes from the respective disciplines that mathematically reproduce certain phenomena and behaviours of the real world. The so-called map algebra, for example, is a suitable method for this. Noise propagation in the air or pollutant propagation in water bodies can be modeled and calculated with GIS support, usually using a combination of large simulation models and GIS. Geodata is fed into the simulation model, the results of the simulation can be visualized in the form of isolines in GIS.
